
 In
In 
The security appliance market registered eleventh consecutive quarter of growth in the first quarter of 2016 (1Q16), as per IDC. Top four vendors accounted for more than 53% of the market share. The market grew 5.5% year over year to USD 2.47 billion, according to IDC.

Leaders
Cisco had the with first quarter revenue of USD 429 million, with a market share of 17.4% from last years’ revenue of USD million 407 and equal market share of 17.4%, marking a year over year growth of 5.4%.
Check Point was the closest competitor with first quarter revenue of USD 342 million up from USD 407 as revenue of last first quarter of 2015 with a year over yeat growth rate of 11.1%
Palo Alto Network was ranked third by IDC with revue of USD 307 million in first quarter of 2016 but it marked the highest growth of 40.9% from last year’s first quarter revenue of USD 218 million.
Fortinet and Blue Coat were ranked 4th and 5th respectively with growth of 29.6% and -0.08% respectively and first quarter market revenue of USD 247 million and USD 113 million respectively.

Category wise market
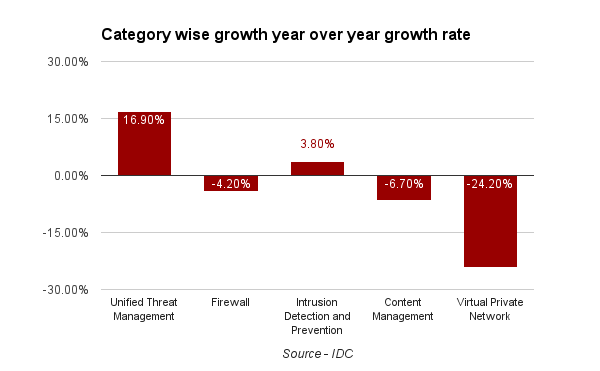
The Unified Threat Management (UTM) category has doubled in size over the last five years and continues to be the major driver for the overall market. For the first quarter of 2016, the UTM market generated USD 1.25 billion in revenues for year-over-year growth of 16.9%.
Intrusion Detection and Prevention (IDP) marked a huge share of revenue worth USD 372 million and 3.8% annual growth.
The Firewall, Content Management, and Virtual Private Network (VPN) categories experienced a slow start to the year with year-over-year revenue declines of 4.2%, 6.7% and 24.2%, respectively.
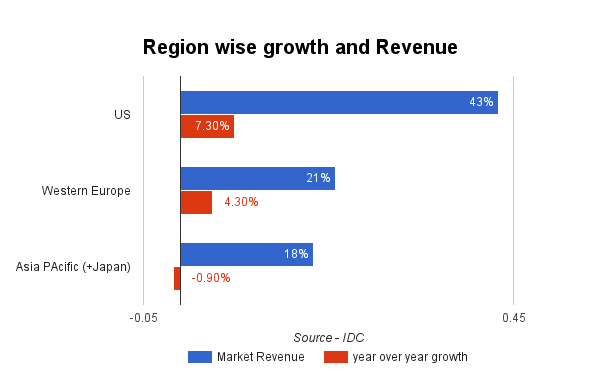
Region wise Market
The
Add new comment